

Main Chat Bar:
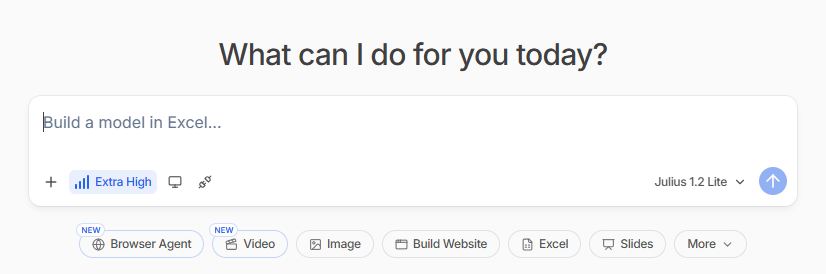
Reasoning Intensity
Reasoning Intensity
Controls how deeply Julius thinks before responding. Set via the bars icon next to the intensity level.
- Low / Medium - Fast responses, best for simple questions.
- High / Extra High - Extended thinking. The model thinks longer, writes more complex code, and double-checks results. Use for messy data cleaning, complex analysis, modeling, or when accuracy matters more than speed.
Code Sandbox
Code Sandbox
Click the screen/window icon to view and manage your code execution environment. The Code Sandbox is where Julius runs all code behind your analysis.
- Code Sandbox status - Shows whether your sandbox is Healthy or needs attention.
- RAM & CPU - Live usage of your container resources (e.g. 0.0/8GB RAM, 0% CPU).
- Code Language - The runtime Julius is currently using (e.g. Python). Click to switch between Python, R, and other supported runtimes.
- Reset - Restart the sandbox if it is slow or behaving unexpectedly. This clears the execution state but keeps your files.
- Sandbox Settings - Additional configuration for your code environment.
Connectors
Connectors
Click the link/nodes icon to open the Connectors panel, where you can connect external data sources and tools to Julius.Integrations
- Slack - Connect your Slack workspace to receive reports and insights.
- BigQuery - Connect your BigQuery data for instant AI analysis.
- Snowflake - Connect your Snowflake data for instant AI analysis.
- Postgres - Connect your Postgres data for instant AI analysis.
- MySQL - Connect your MySQL data for instant AI analysis.
- SqlServer - Connect your SqlServer data for instant AI analysis.
- Supabase - Connect your Supabase data for instant AI analysis.
- Google Drive - Analyze your Google Drive files and folders.
- Google Sheets - Live connection to your Google Sheets.
- Microsoft OneDrive - Analyze your Personal OneDrive files and folders.
- SharePoint - Analyze your SharePoint or OneDrive for Business files.
- Google Ads - Analyze your data and manage your campaigns in Google Ads.
- Meta Ads - Analyze your data and manage your campaigns in Meta Ads.
Model Selector
Model Selector
Click the model name (e.g. Julius 1.2 Lite) to switch between available models.Julius models
- Julius 1.2 Ultra - For only the most complex tasks.
- Julius 1.2 Max - Most capable agent for complex analysis.
- Julius 1.2 - Best for most questions.
- Julius 1.2 Lite (default) - Fast agent for quick questions.
- Claude Sonnet 5 - Anthropic latest Sonnet model.
- Claude Fable 5 - Anthropic storytelling-optimized model.
- Claude Opus 4.8 - Anthropic most capable model.
- Muse Spark 1.1 - Creative and generative tasks.
- GPT-5.6 Sol - OpenAI latest model.
- Grok 4.5 - xAI conversational model.
Browser Agent
Browser Agent
Let Julius control a real browser. It can go to a website, log in, click buttons, fill forms, scrape JS-heavy pages, or book/apply/order something. Use when you need to do something on the web, not just search it.
Video
Video
Text-to-video, image-to-video, or video editing. Generates MP4s using Sora/Veo-style models. Give it an image and a prompt, or ask it to edit an existing video.
Image
Image
Generate or edit images. Create charts, infographics, logos, edit an uploaded image, remove backgrounds, and more.
Build Website
Build Website
Generates a full interactive website, dashboard, or web app as an HTML artifact you can preview and publish. Great for dashboards, portfolios, and data apps.
Excel
Excel
Build advanced Excel workbooks with formulas, multi-sheet models, pivot tables, VBA, and XlsxWriter with a properly formatted, downloadable
.xlsx file.Slides
Slides
Builds a polished 16:9 HTML slide deck you can export to PPTX. Creates animated, styled presentations with charts, not just bullet points.
More
More
Additional output formats Julius can build for you:
- Stock Analysis - Analyze stocks, pull financial data, and generate investment insights.
- Dashboard - Build an interactive multi-panel dashboard to explore and present your data.
- Report - Generate a structured, formatted report summarizing your analysis.